Analytics Marketing Dashboard
The Marketing dashboard displays marketing assets currently being managed and/or used in order to help guide marketing content strategy. Available data includes: created and in-use assets, aging content, and level of use/popularity.
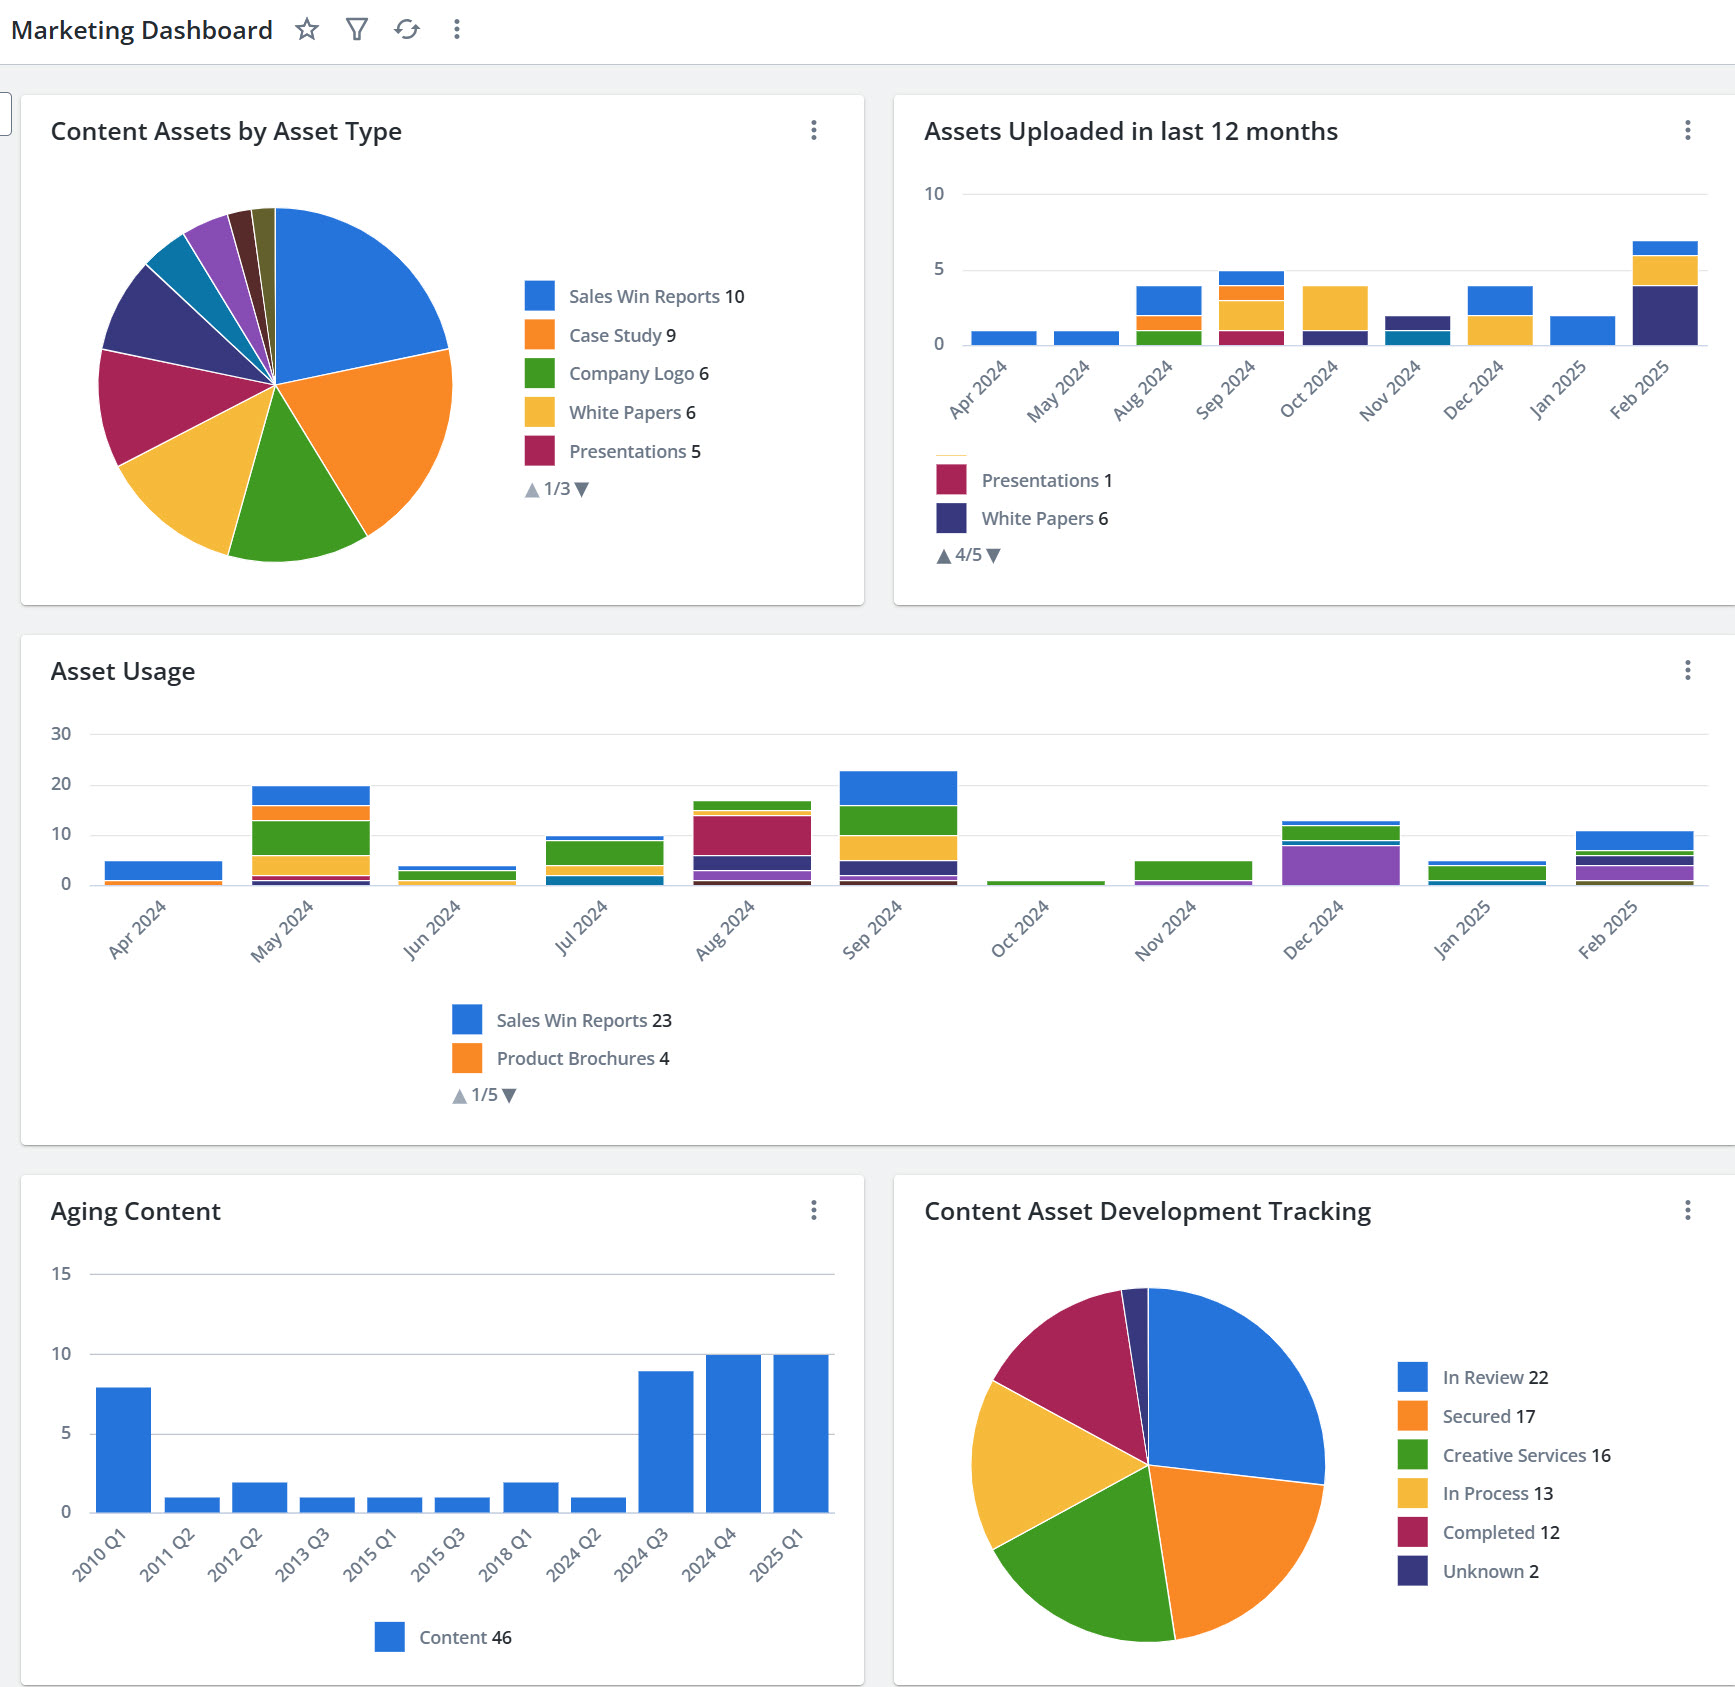
An example of the Upland Analytics Marketing dashboard.
Note: When a filter is applied, a header with the number of fields that were filtered appears on the dashboard. For more information on filters, see Apply an On-Page Filter - Dashboard.
Content Assets by Asset Type
The Content Assets by Asset Type pie chart shows a breakdown of content counts by asset type.
Assets Uploaded in Last 12 Months
The Assets Uploaded chart shows a monthly breakdown of assets uploaded in the last 12 months (including the current month). The asset upload count is listed on the vertical axis of the graph. The horizontal axis shows the types of uploaded assets organized by month.
Asset Usage
The Asset Usage chart shows a monthly breakdown of assets used in the last 12 months (including the current month). This tracks all user clicks, views, and external spotlight visits. The asset usage count is listed on the vertical axis of the graph. The horizontal axis shows the types of assets used organized by month.
Aging Content
The Aging Content chart shows a quarterly breakdown of aging content totals.
Content Asset Development Tracking
The Content Asset Development Tracking pie chart shows content counts by step category.
Note: The Upland RO Innovation Help Center has information on Upland RO Innovation standard dashboards, fields, sources, and related events. To learn more about working with the dashboards and reports, see the Upland Analytics Help Center.